SeaDataNet broker portal URL: https://gs-service-production.geodab.eu/gs-service/seadatanet-broker/search
The portal provides a user-friendly search interface to discover marine dataset collections which are managed at the following major international marine data portals:
· Australia Ocean Data Network (AODN - Australia)
· SeaDataNet (SDN - Europe)
· US – NOAA National Centers for Environmental Information (NCEI - USA
· NOAA World Ocean Database (WOD - USA)
After discovery, users are pointed to the individual portals for more detailed information and services for actual access of the data collections. This service has been set up to to help users in search of marine data to locate quickly possibly relevant data collections. There might be overlaps in collections as managed at the different portals as the service gives individual indexes, although different processing and validations might have been applied, probably resulting in other versions of same original data sets.
The first section of this help guide describes the portal main components.
The subsequent two sections guide the user to making use of the supported discovery modalities: query by constraints and filtering of results. They are both used to limit the available results to the ones interesting to the user and can also be used jointly.
The last section is about evaluation of the matching results.
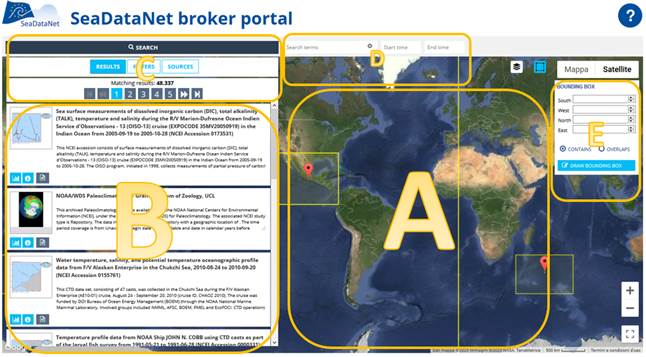
The portal features:
A) A big map portraying extents of the matching datasets.
B) A result panel detailing metadata elements of the matching datasets.
C) Control panel with buttons:
a. Search: to execute a query using the selected constraints
b. Results: to show result panel
c. Filters: to show filter panel
d. Sources: to select source constraints
e. Pagination buttons to browse the result list
D) Upper toolbar containing input fields to:
a. Select search term constraints
b. Select temporal constraints
E) Floating panel to select spatial constraints
In this discovery modality user formulates a query, by selecting one or more constraints, then execute it.
The query constraints limit the result set only to records matching all the selected constraints.
Available query constraints are:
· Search terms
· Spatial extent
· Temporal extent
· Sources
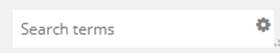
User can input search terms by directly typing them in the Search terms input field (D area) (e.g. CTD, temperature).
Only datasets documenting the input text in the Title or Keyword metadata element match this constraint.
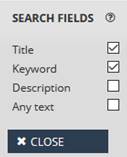
This default behavior can be modified, by clicking the little gray engine at the top right of the Search Terms field. It will open the following panel enabling to choose which are the metadata elements to be checked in order to match.
Two modes are available to select spatial extent:
· Text input
· Map input
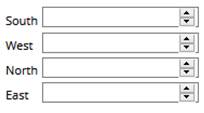
User can select spatial extent constraint by direct input the extent specifying the corner coordinates in the bounding box panel (E area):
· South: southern-most coordinate of the limit of the spatial extent, expressed in latitude in decimal degrees (positive north). Valid domain is a decimal value in -90 <= South <= North <= 90
·
North:
northern-most, coordinate of the limit of the spatial extent, expressed in
latitude in decimal degrees (positive north). Valid domain is a decimal value
in -90 <= South <= North <= 90
·
West:
western-most coordinate of the limit of the spatial extent, expressed in
longitude in decimal degrees (positive east). Valid domain is a decimal value
in -180 <= West <= 180
· East: eastern-most coordinate of the limit of the spatial extent, expressed in longitude in decimal degrees (positive east). Valid domain is a decimal value in -180 <= West <= 180

By clicking on Draw bounding box button the spatial extent constraint will be drawn on the map, in dark blue color, as in the following figure.
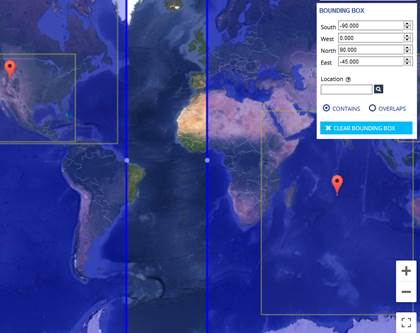
Note that bounding boxes crossing the antemeridian are also supported. These are expressed with East < West, as in the example above.
Only datasets documenting the spatial extent within the user bounding box will match this constraint. To match also datasets having spatial extent that more generally intersect the user bounding box it’s possible to select the overlaps option.

User can also draw a modifiable bounding box by directly clicking on the draw bounding box button.
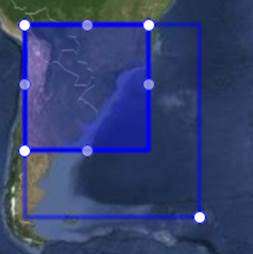
The bounding box obtained with one of the described methods can be readily modified by dragging with the mouse one of the white control points, as in the above figure, to match the user area of interest.
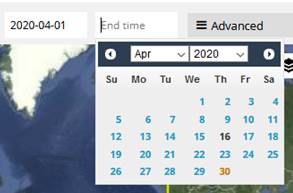
User can select temporal extent constraint through the begin time and end time inputs (D area). The dates can be typed in the ISO 8601 form: year (4 digits) ‘-‘ month (2 digits) ‘-‘ day (2 digits). Alternatively the date can be picked through the interactive calendar that will be opened by focusing on the time input.
Note that even an open temporal extent represents a valid selection (e.g. only specifying the begin time).
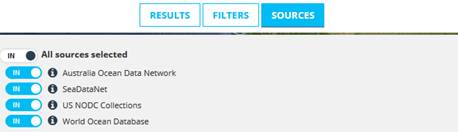
By clicking on the Sources button (C area) the source constraint panel above is shown.
By default all data sources are queried.
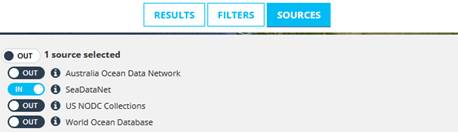
User can include/exclude sources to be queried by clicking on the switch button (IN/OUT) at the left of each source. In the above example the selected constraint limit results only to datasets from SeaDataNet source.
After selecting one or more of the above constraints the query can be submitted by pressing on the search button (C area):
![]()
The result set will contain now only records matching the selected constraints. Results can optionally be further filtered following the information in the next section filtering of results. Finally, evaluation of results section provides additional information about examining the obtained results.
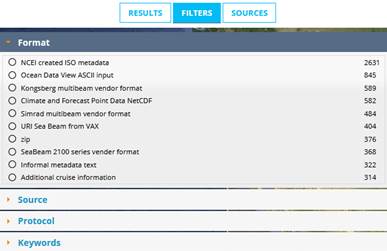
User can filter current result set through the filter panel clicking on the Filters button (C area).
Filters can be applied to the following metadata elements:
· Format
· Source
· Protocol
· Keywords
· Instrument
· Platform
· Organization
· Attribute
For each of them, an ordered list of the more documented values found in the result set is displayed, along with their correspondent number of occurrences.
Example given, in the above screenshot 376 datasets document zip as a possible distribution format.
By clicking on a specific documented value the result set will be updated by limiting it only to datasets documenting the specific value. Example given clicking on zip value for metadata element format the result set will be only datasets documenting the value zip amongst distribution formats.
Filters can be iteratively applied on different metadata elements and element values to increasingly reduce and refine the result set.
Finally, evaluation of results section provides additional information about examining the obtained results.
The results matching the query and the filters are listed in the result panel (B area), in pages of ten elements each ranked according to an algorithm that takes into account the matching score of the user query constraints and the metadata quality of each record. Moreover, extents of the listed records are portrayed on the map (A area).
The total number of matching records is also displayed (C area), along with pagination buttons enabling to browse the pages.
It follows the example of a returned record:
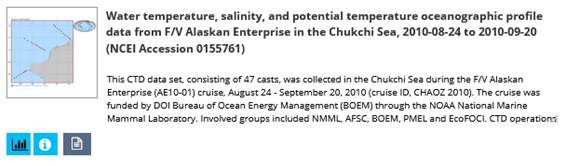
The dataset title is shown in bold, followed by its abstract information. A graphic overview is displayed on the top left, and the temporal extent is shown on the right (where available).
On the bottom left three buttons are available:
· Measurement info
· More info
· Full metadata
By clicking on the first button ![]() , a panel similar to the following will open:
, a panel similar to the following will open:
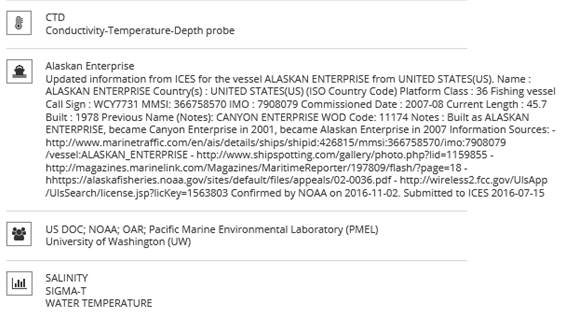
It shows four important metadata elements related to dataset observations and measurements:
· Measuring instrument: the instruments used to obtain the measurements included in the dataset (e.g. CTD)
· Platform: the platforms used to carry the measuring instruments (e.g. RV Polarstern)
· Organization: the organizations responsible for the observations and measurements included in the dataset (e.g. IFREMER)
· Attribute: the attributes (aka parameters) measured (e.g. salinity)
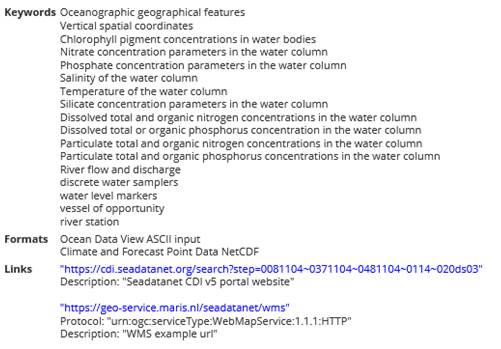
By clicking on the second button ![]() the following panel will show, detailing other
important metadata elements (e.g. keywords, distribution formats and online
resources).
the following panel will show, detailing other
important metadata elements (e.g. keywords, distribution formats and online
resources).
By clicking on the third button ![]() , a XML metadata
document encoded according to ISO 19139 schema will be opened. This metadata
document describes the record with the maximum number of metadata elements
available.
, a XML metadata
document encoded according to ISO 19139 schema will be opened. This metadata
document describes the record with the maximum number of metadata elements
available.
SeaDataNet broker portal has been developed by ESSI-Lab of CNR-IIA in collaboration with MARIS in the context of EU H2020 programme under grant agreement 730960, SeaDataCloud project (2016-2020).